Market intelligence
Territory Insights
Regional sales territory BI — map views, side-by-side comparisons, and growth rankings.
Planning confidence
+27%
Improved alignment during territory reviews.
Coverage gaps
-34%
Gap areas identified and assigned faster.
Review prep
-49%
Less manual prep before weekly meetings.
Project context
Built for real operational constraints
Managers needed territory coverage and growth signals in one decision surface.
Coverage, capacity, and growth indicators lived in separate tools with conflicting definitions.
Client profile
Field growth team comparing territory performance and capacity.
Delivery timeline
5 weeks with two manager calibration cycles.
Stack
Product snapshot
The solution in action
The same lead image style used on the Work grid is carried here for a consistent premium visual narrative.
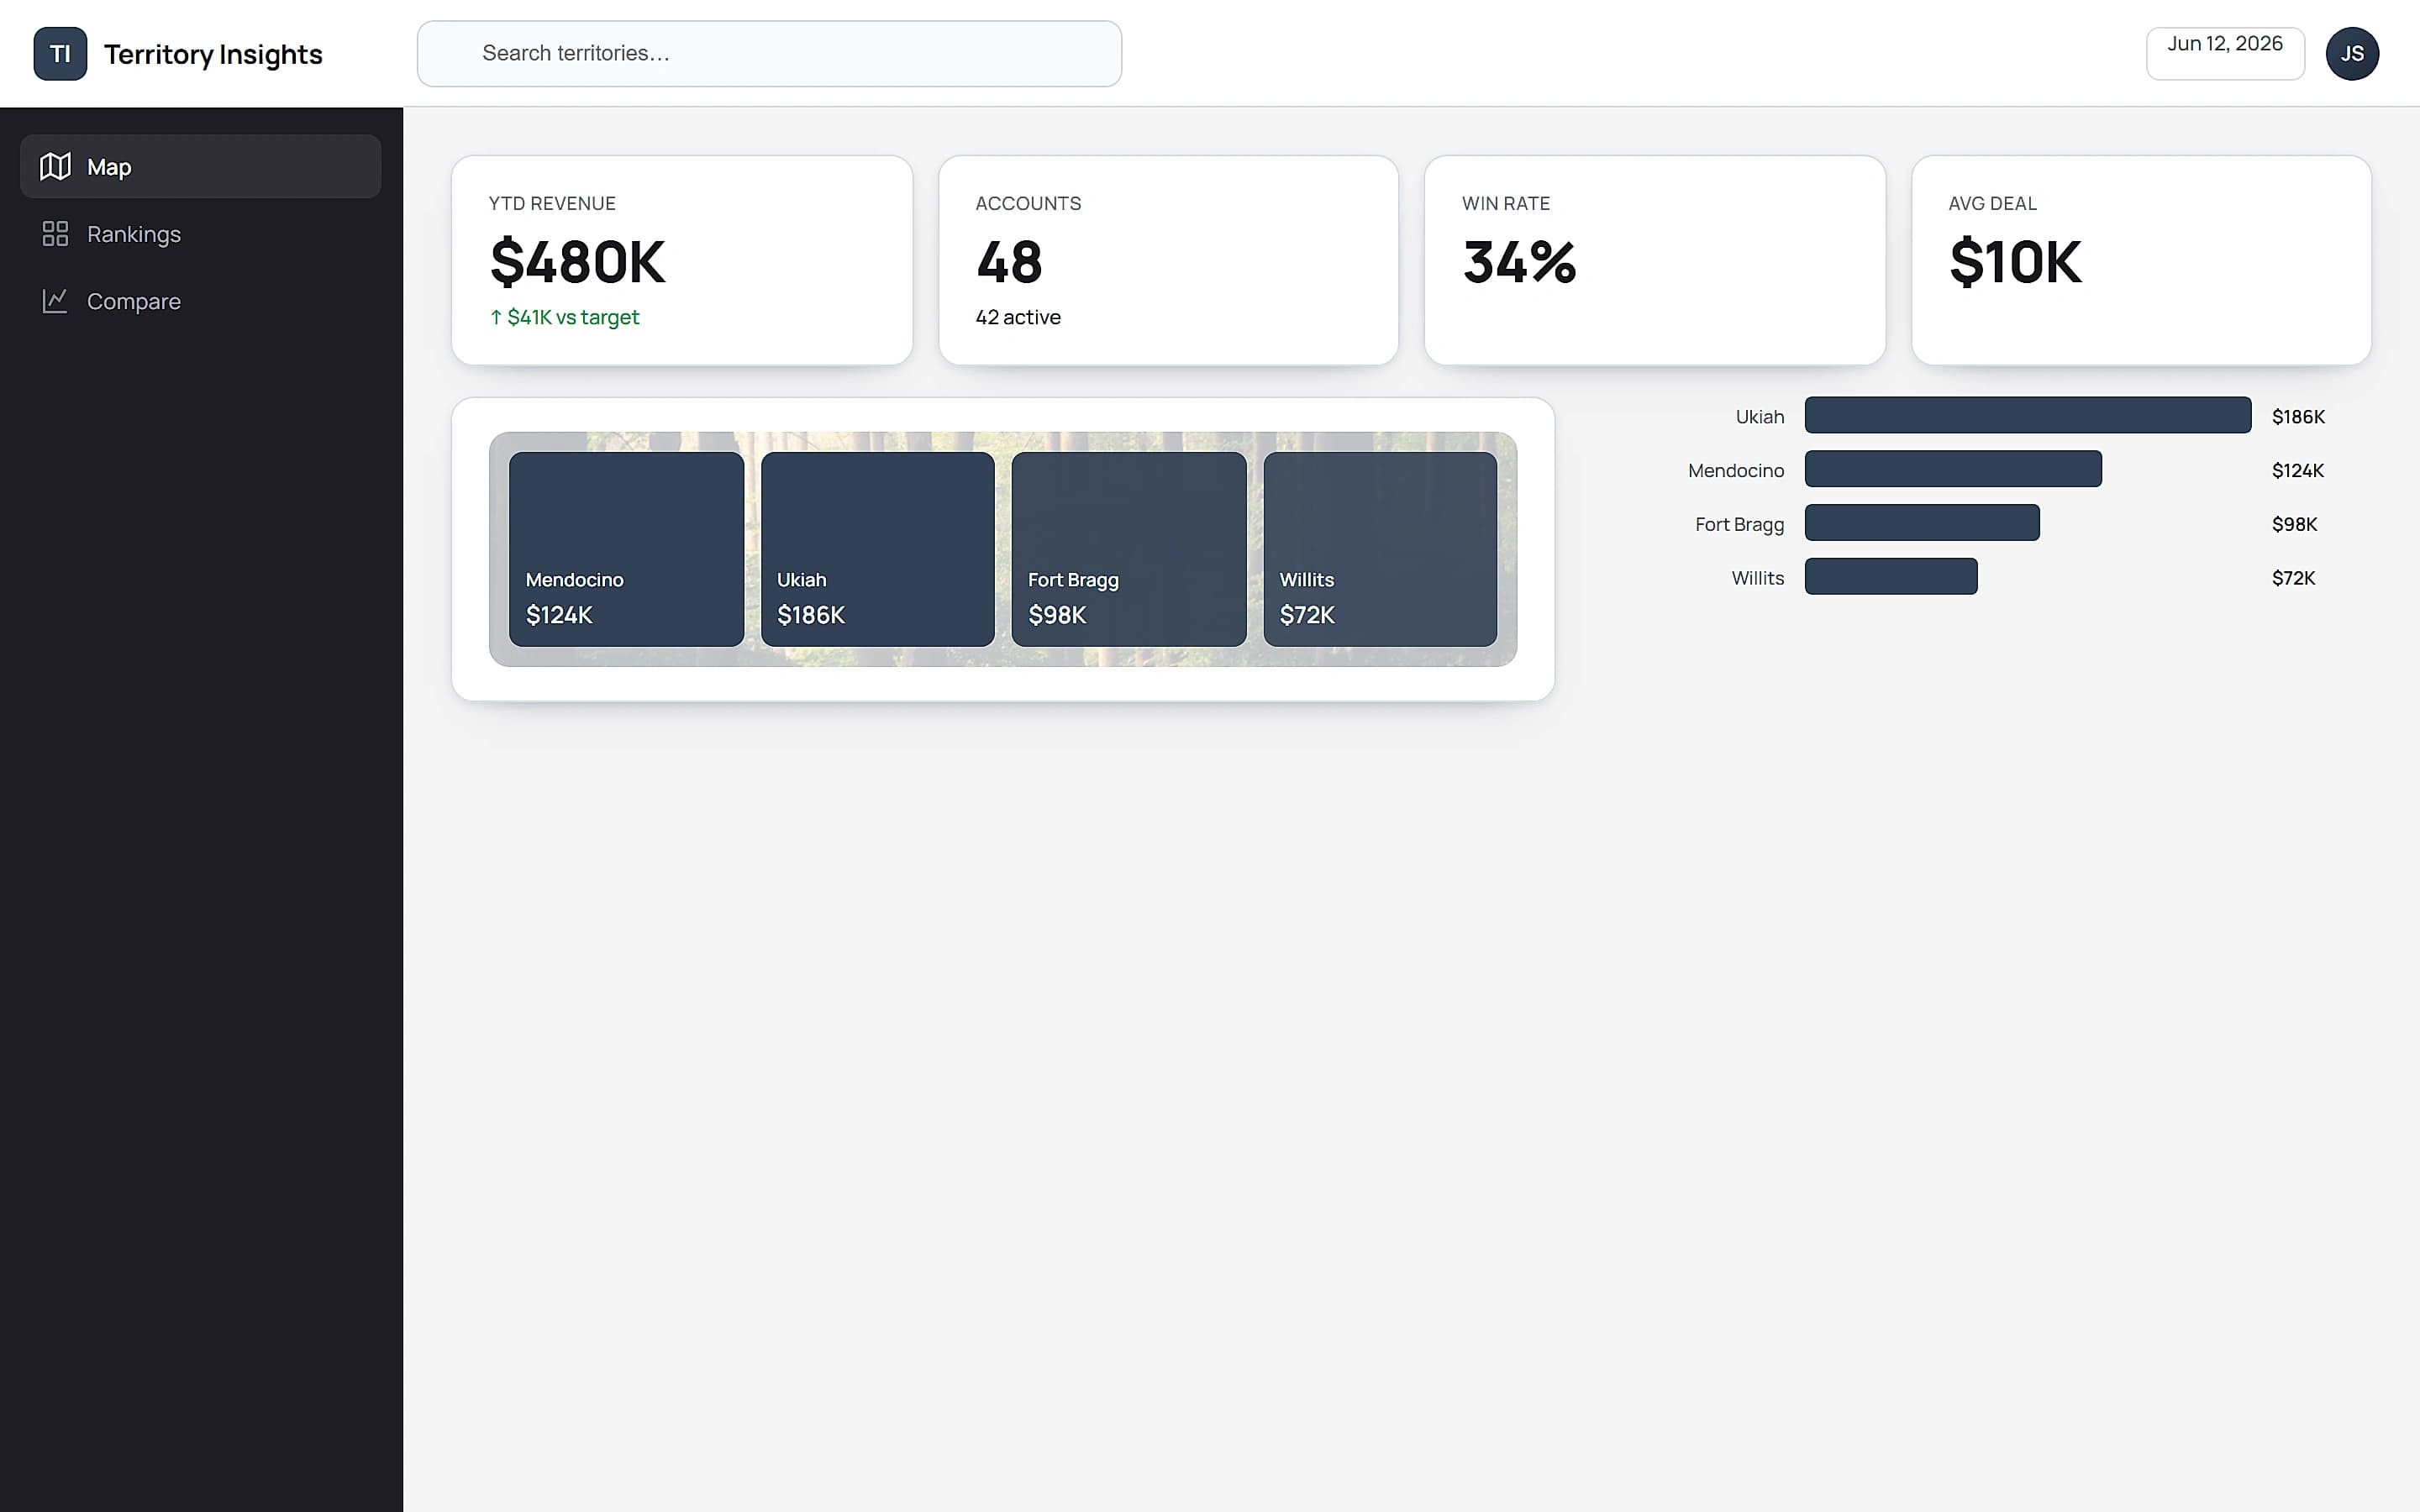
Coverage overview
Territory map with headroom and performance indicators.
The challenge
Coverage, capacity, and growth indicators lived in separate tools with conflicting definitions.
The approach
We assembled a territory intelligence dashboard that aligns coverage, potential, and pipeline signals.
Implementation details
- Unified territory hierarchy and ownership rules.
- Built growth scorecards with trend indicators.
- Added manager-level comparison views for planning meetings.
Business outcomes
- Territory decisions backed by comparable data
- Growth opportunities visible on a map
- Rankings replace subjective territory reviews
Mendocino County
39°18′N · 123°24′W
Let's talk about your business.
Tell us what your business does, what slows you down, and what you wish you could see on one screen. We reply within one business day.
Start the conversation
Pick what sounds closest — we'll use it to jump-start our first call.