Retail BI
Margin Map
Multi-store retail analytics — sales, margins, and category performance across locations.
Pricing cycle speed
+31%
Faster territory-level decisions.
Reporting effort
-52%
Reduced manual data preparation.
Margin visibility
Real-time
Live trends replaced periodic snapshots.
Project context
Built for real operational constraints
Leadership needed visual margin intelligence by region for faster pricing decisions.
Margin analysis required manual regional slicing and reconciliation before each planning cycle.
Client profile
Regional operations team analyzing margin performance by territory.
Delivery timeline
6-week delivery with phased regional rollout.
Stack
Screen walkthrough
The workflow from overview to outcomes
Each image represents a specific step in the operational flow. This keeps the case study visual, concrete, and decision-focused.
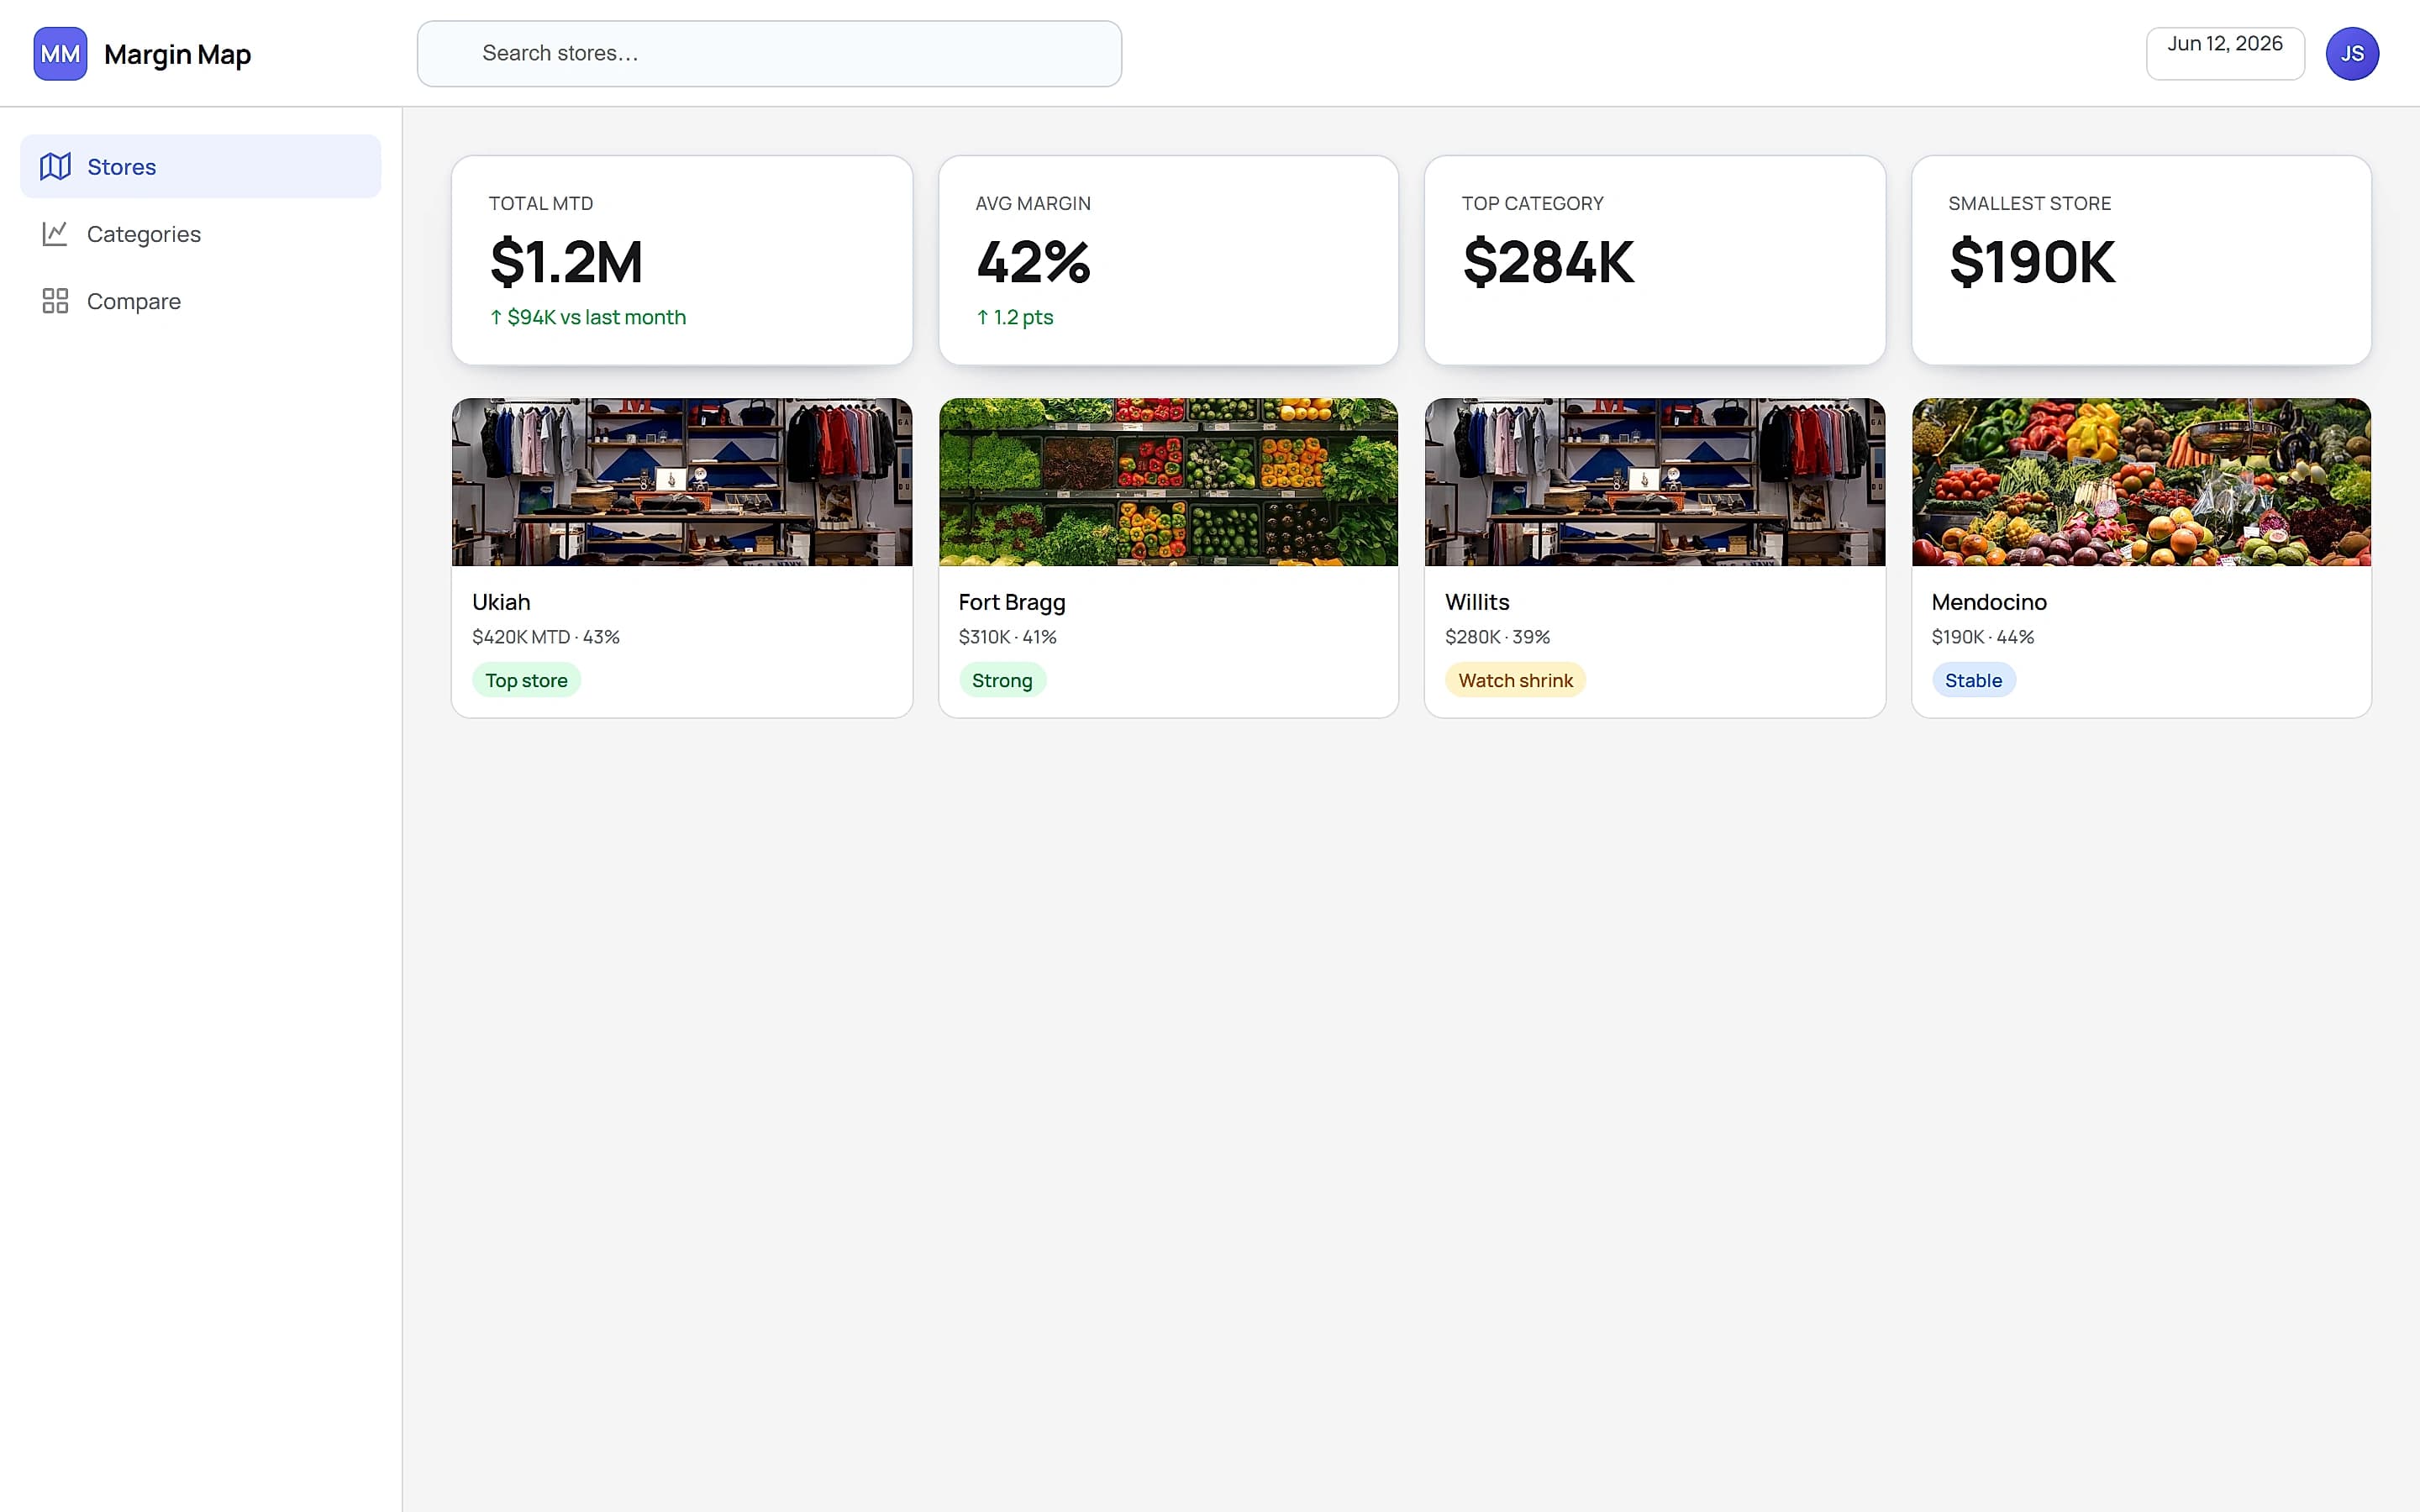
Overview
Territory overview
Regional margin map with immediate outlier visibility.
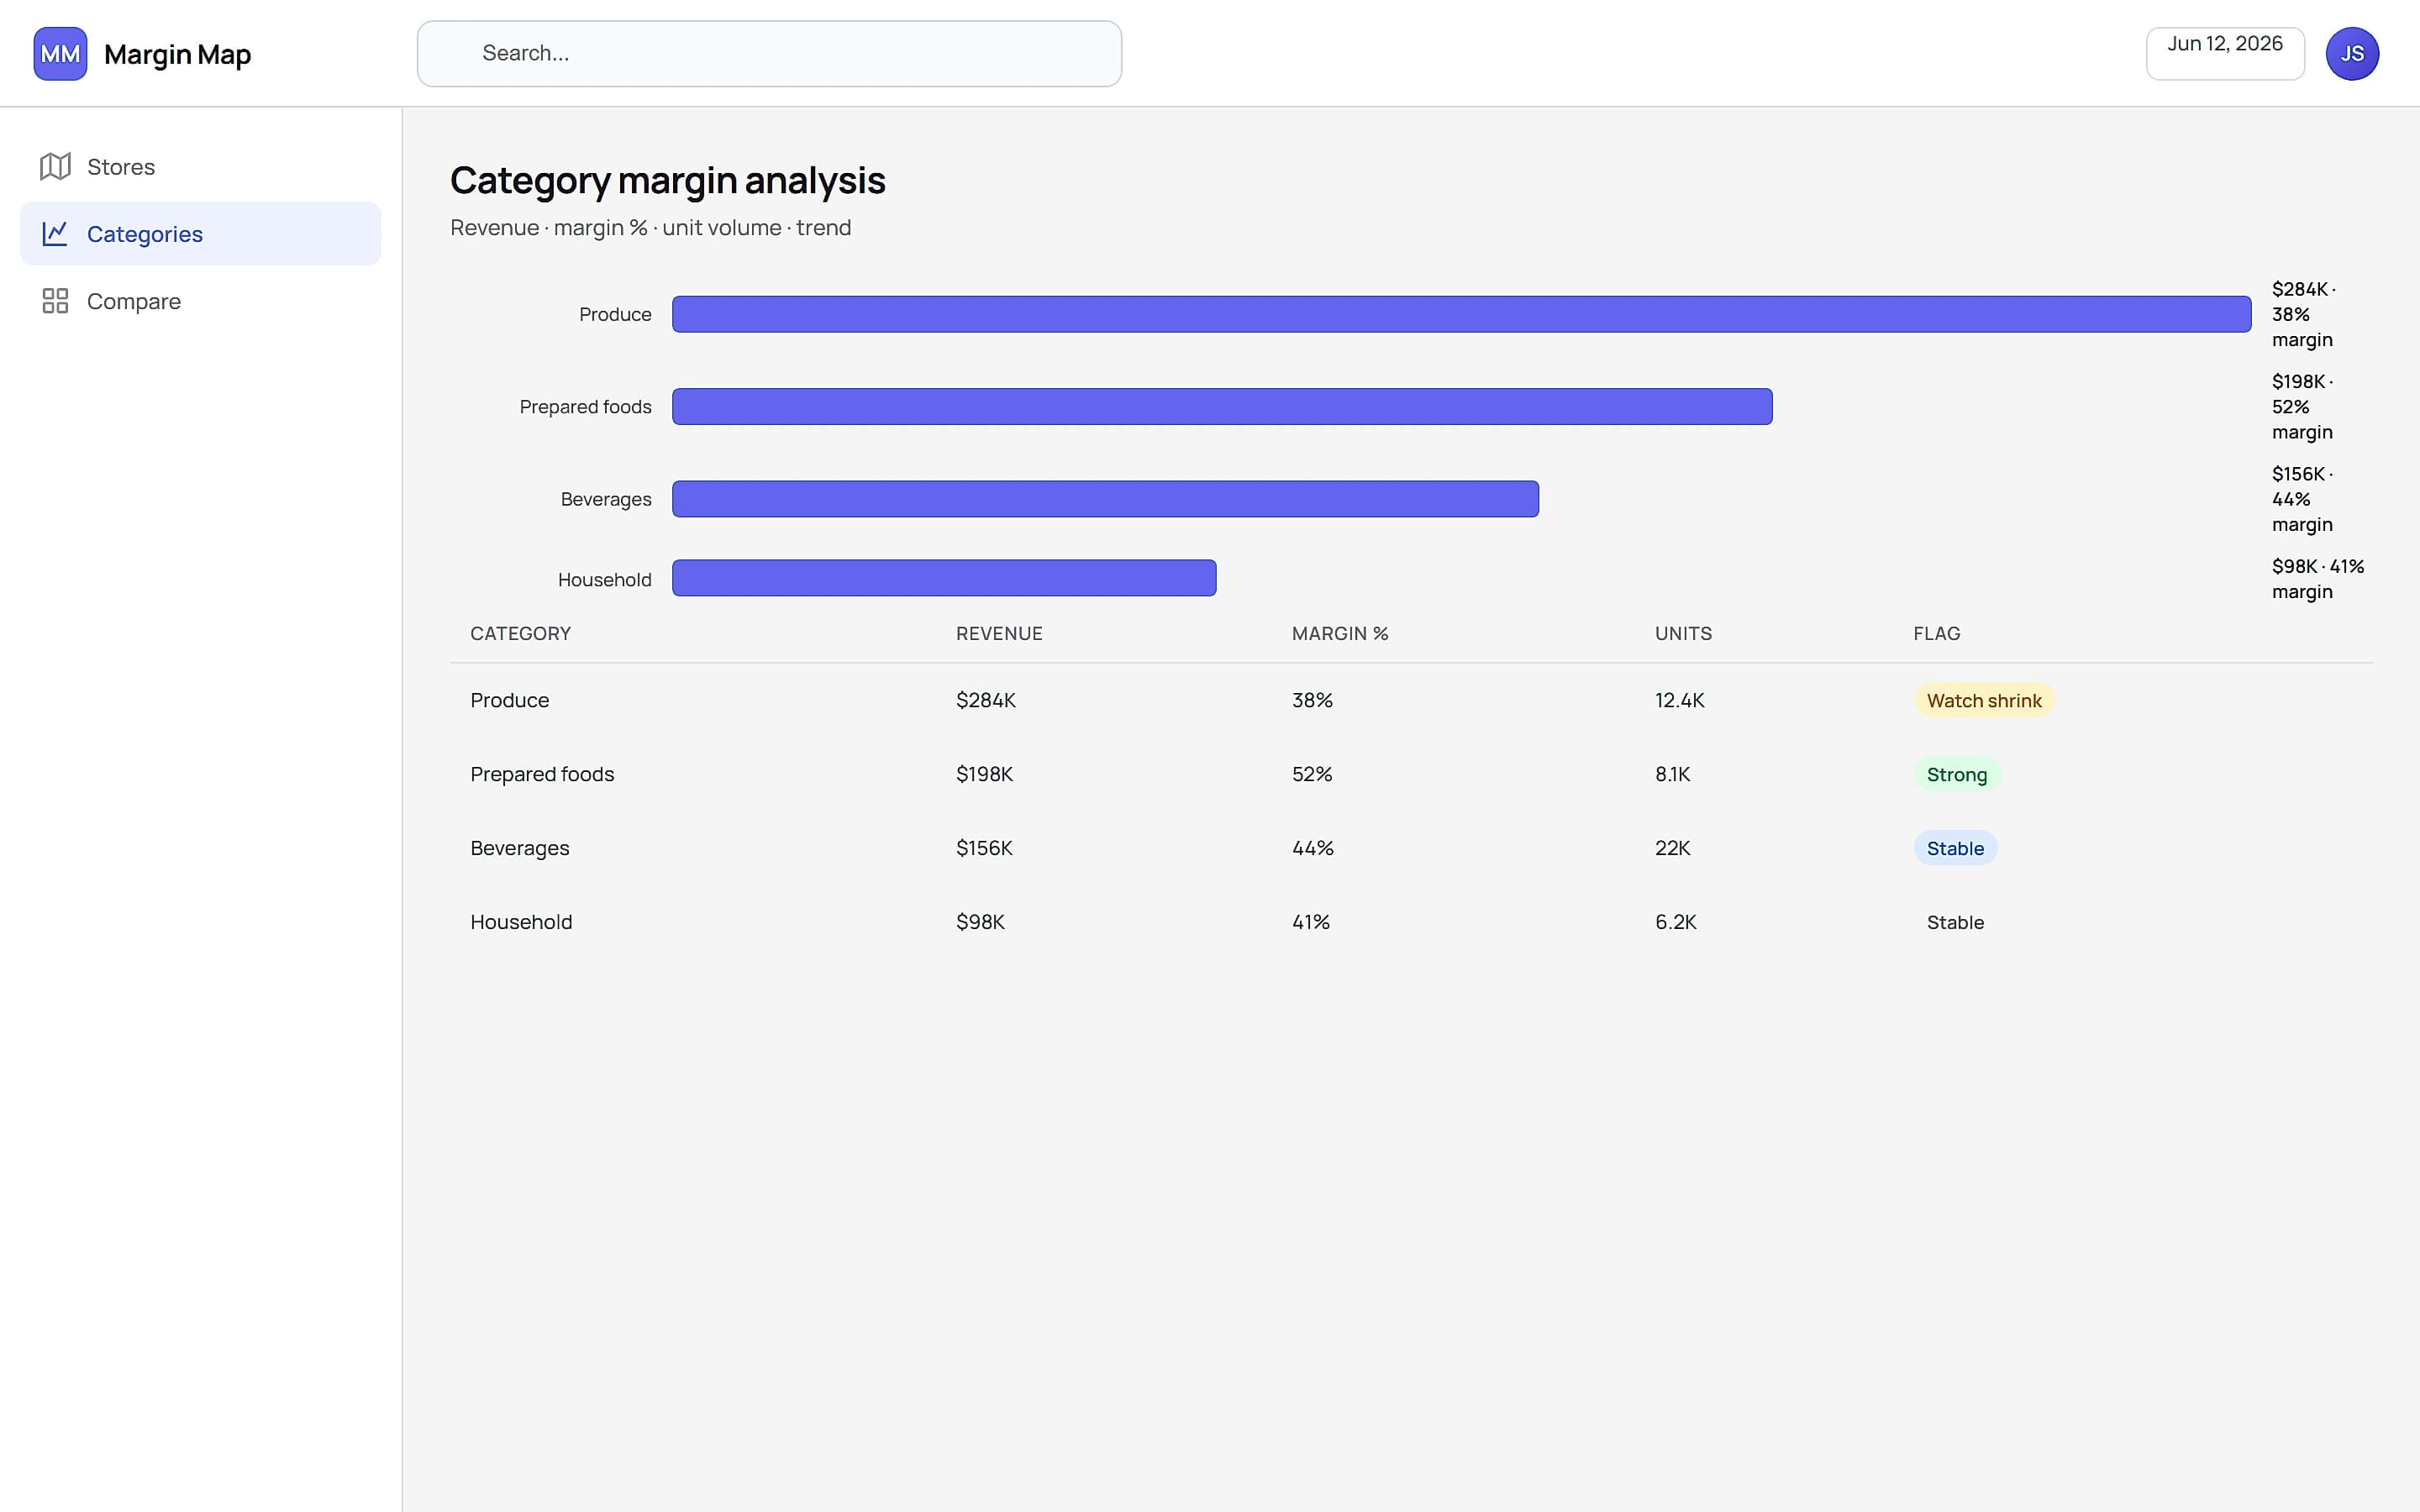
Workflow
Analysis workflow
Segment-level drilldown for margin diagnosis.
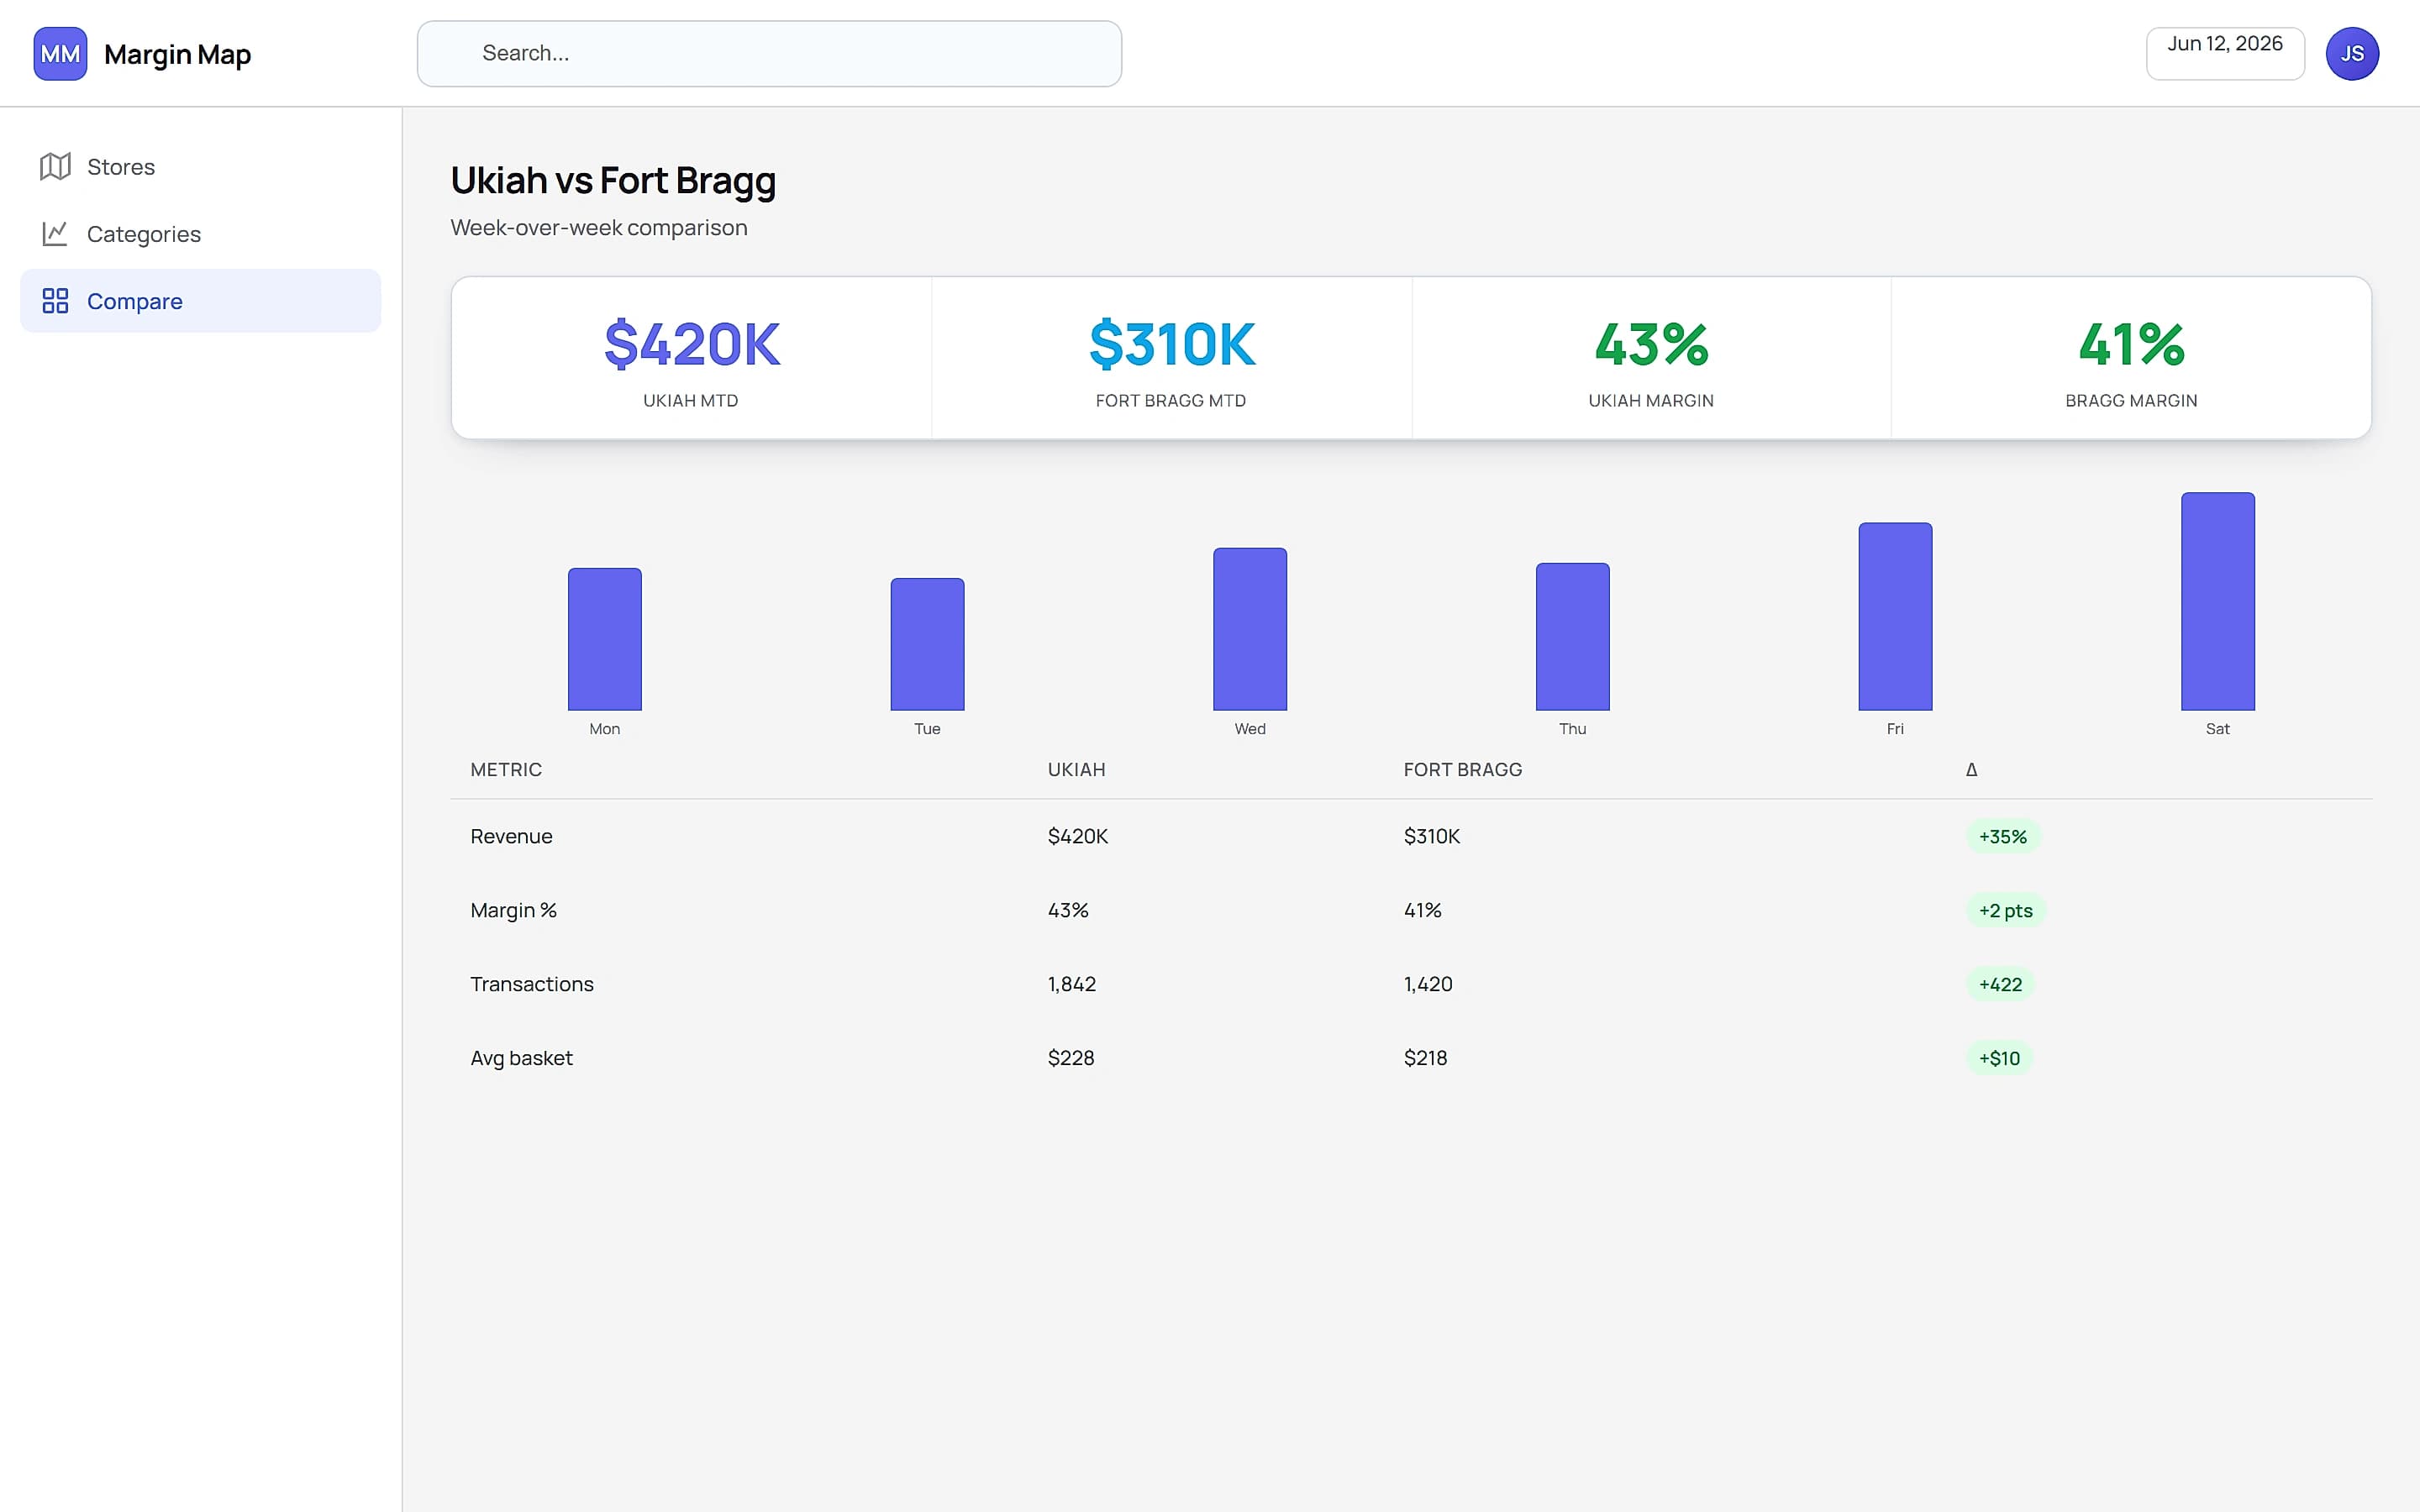
Outcomes
Outcome reporting
Executive-ready comparisons for planning cycles.
The challenge
Margin analysis required manual regional slicing and reconciliation before each planning cycle.
The approach
We produced a map-driven margin workspace with territory benchmarking and drilldown by account segment.
Implementation details
- Defined territory-level margin model and normalization logic.
- Built visual drilldowns by segment and product mix.
- Added export-ready executive summary views.
Business outcomes
- Store comparisons in seconds not hours
- Margin issues visible by category
- Owners act on trends same week
Mendocino County
39°18′N · 123°24′W
Let's talk about your business.
Tell us what your business does, what slows you down, and what you wish you could see on one screen. We reply within one business day.
Start the conversation
Pick what sounds closest — we'll use it to jump-start our first call.